Hint: This website is not optimized for your browser version.
Electricity trade in July and August 2017
September 26, 2017 - Germany was again an exporter of electricity in the summer. In addition to Austria, the largest importers of electricity generated in Germany were Switzerland, France and the Czech Republic. In July and August 2017, net exports crossing Germany’s borders were below last year’s levels. The average price on the day-ahead market of the exchange was €31.93/MWh.
In July, net commercial electricity exports from Germany amounted to 2.999 gigawatt hours (GWh). This corresponds to just over 7% of the electricity generated in Germany in July. After deducting imports, Germany exported 2,165 GWh of electricity to Austria, more than to any other country. In the course of the month, gross exports to Austria amounted to 2,906 GWh with gross imports at 741 GWh. At 970 GWh, gross exports to Switzerland were still considerably higher than those to the Czech Republic, which amounted to 620 GWh. Conversely, net exports from both countries remained similar to each other (Switzerland 420 GWh, Czech Republic 414 GWh). This was down to the the varying imports from both countries. While 549 GWh were imported from Switzerland, imports from the Czech Republic, totalling 206 GWh, did not even come close to matching half of Swiss imports.
Net commercial exports in August amounted to 3,722 GWh, just over 20% higher than those recorded for July. Although Austria was the largest consumer of electricity generated in Germany in August (net exports: 1,373 GWh), the figures were well below those recorded for July. By contrast, net exports to the Netherlands totalled 1,108 GWh, just short of the volume exported to Austria. Gross imports from Austria amounted to 1,259 GWh, while 90 GWh were imported (gross) from the Netherlands.
You can create a graph that presents these figures using SMARD’s market data
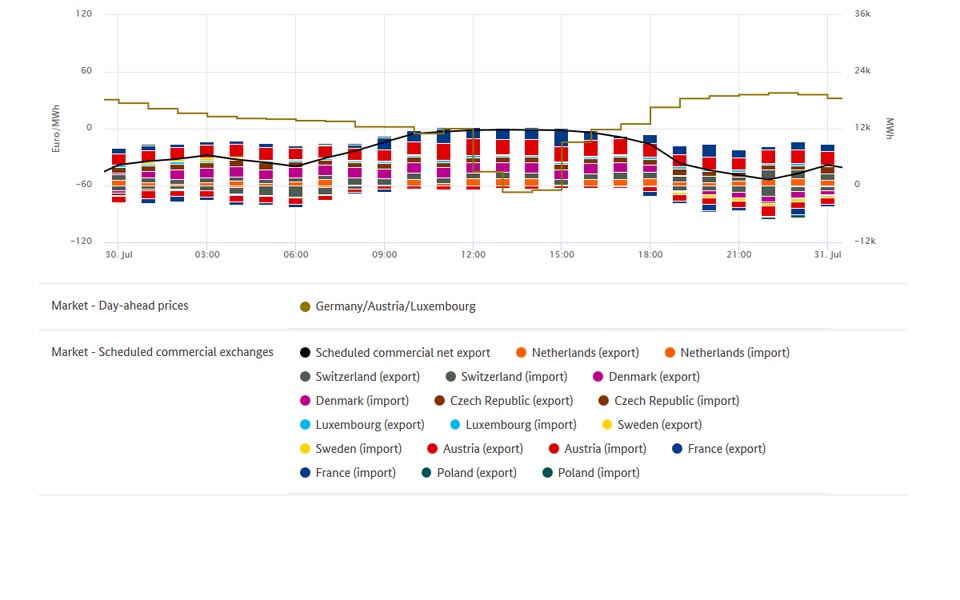
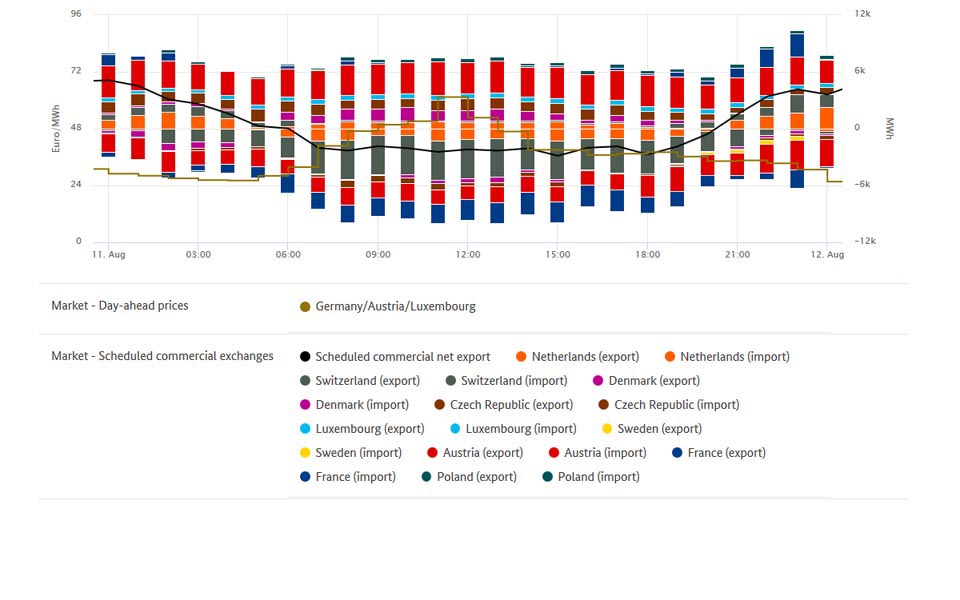
The chart gives an overview of Germany's commercial electricity trade with Austria, the Czech Republic, the Netherlands and Switzerland. In terms of volume, the most electricity was traded with Austria, followed by Switzerland, the Netherlands and the Czech Republic. (Gross) exports are shown above the zero line while (gross) imports are shown below the zero line.
Compared to the same months in the prior year, German net exports decreased in 2017. Net exports amounted to 3,177 GWh in July 2016 and 4,003 GWh in August 2016. Compared to the figures for 2017, this represents a drop of 6% for July and 7% for August.
The wholesale price in Germany
The wholesale price on the day-ahead-market is also interesting when looking back on July and August 2017. The wholesale price ranged between €61.36 and €-67.05 per megawatt hour (€/MWh) and averaged €33.01/MWh in July and €30.85/MWh in August. The price’s peak was reached on 11 August, its low on 30 July. However, these figures only correspond to snapshots that apply to a particular hour of a day. It is therefore a good idea to take a closer look at the prices.
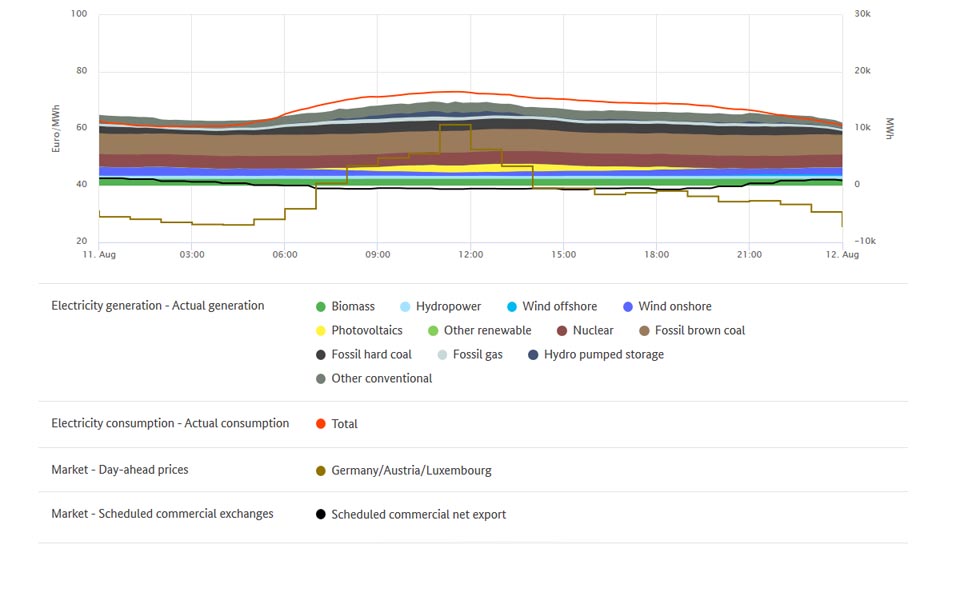
The highest price on the exchange, over the course of those two months, was recorded on Friday 11 August, between 11am and noon. A look at data on electricity generation provides an explanation. PV (4.7 GWh) and wind energy (2.5 GWh) feed-in was relatively low. This means supply went down and prices went up. Germany imported electricity from other countries since electricity in other bidding zones was less expensive at that time. Net imports to Germany amounted to 2.4 GWh.
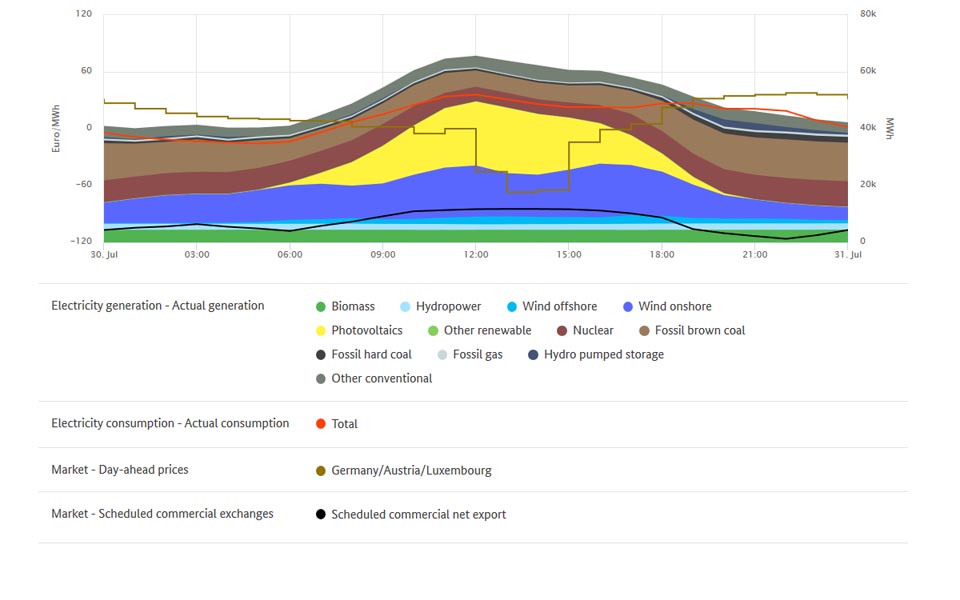
At the time of the lowest electricity price on Sunday 30 July, between 1 and 2pm, it was the other way round. For German traders, it was profitable to sell electricity to other countries. Net exports amounted to 11.8 GWh. In contrast to the hour with the highest electricity price, feed-in figures for renewables were much higher when demand was low at the time when the lowest electricity price was recorded. Over the course of that hour, photovoltaic installations fed in 23 GWh of energy in addition to 18 GWh of wind energy. The result: surplus output from comparatively sluggish conventional power plants. One of the consequences: falling prices that may even dip into the negatives. Negative prices may occur in the short term if there is a significant surplus of electricity and generation from certain installations cannot, for instance, react to electricity prices with enough flexibility because of technical restrictions.


