Hint: This website is not optimized for your browser version.
Electricity market in the second quarter of 2024
Coal generation at record quarterly low
08 July 2024 – In the second quarter of 2024 renewables generated 8.8% more electricity than a year earlier. Total electricity generation decreased by 1.2% while consumption rose by 1%. Germany was a net importer in commercial foreign trade.
In the second quarter of 2024 a total of 100,149.4 gigawatt hours (GWh) of electricity was generated in Germany, representing a slight decrease of 1.2% on the second quarter of 2023.* By contrast, electricity consumption (based on the grid load) rose slightly by 1% to 109,035.4 GWh. The last year-on-year increase in quarterly consumption was from the fourth quarter of 2020 to the fourth quarter in 2021. At 58,005.7 GWh the residual load was 5% lower than a year earlier; this means that a higher proportion of the demand for electricity was met by wind and solar power.
Record quarterly high for renewables
Renewables' share of total electricity generation was 65.3%. Renewables generated a total of 65,393.9 GWh, representing an increase of 8.8% on the previous year and the highest total recorded for any second quarter.
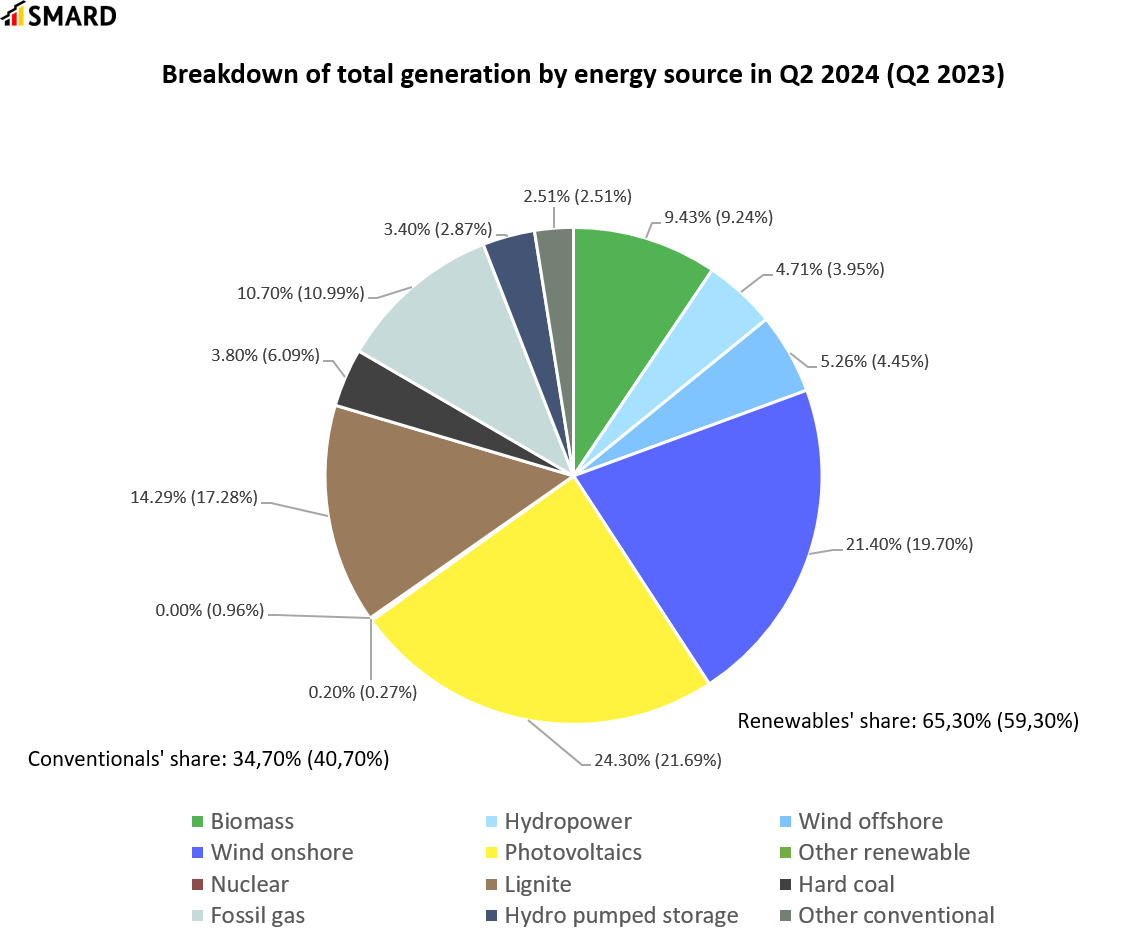
Hydropower saw the largest increase in electricity generation, up by 17.8% to 4,716.5 GWh. This was due to heavy rainfall in May and to the fact that hydropower generation in the second quarter of 2023 had been the second lowest since 2015.
Onshore wind, offshore wind and solar power all reached a quarterly record high. Solar power again accounted for the highest share of generation with 24,335.1 GWh, up 10.7% on the second quarter of 2023. There was an above-average level of sunshine in the north and north-east of Germany in particular in May and June. In addition, the total installed generation capacity of solar installations in Germany was around 10 gigawatts (GW) up on the year before.
There was also growth in wind capacity, with an increase of almost 2.5 GW in the installed generation capacity of onshore wind plants compared with the second quarter of 2023. Total onshore wind generation was 21,431.4 GWh, up 7.3% on the second quarter of 2023. One of the reasons for this increase was the occurrence of several storms, in particular in April and June. Offshore wind generation was 16.8% higher than the year before at 5,263.2 GWh.
Smaller conventional energy sources' share
Conventional energy sources' share of total generation was 34.7% (34,755.5 GWh), compared with 40.7% in the second quarter of 2023. Lignite, hard coal and gas each had a lower share of total generation; the only increase was for pumped hydro stations, which generated a total of 3,401.2 GWh more electricity (+16.9%) than a year earlier. Pumped hydro stations use electricity to fill their reservoirs with water. The source of the electricity they use depends on the generation mix when they fill their reservoirs, which means that they also use electricity from conventional energy sources. This is why they are not counted as a renewable but as a conventional energy source on the SMARD website.
Lignite generation decreased by 18.3% compared with the second quarter of 2023 to 14,311.5 GWh. There was a large decrease of 38.4% in hard coal generation to 3,803.3 GWh. Both generation levels were the lowest recorded since at least 2015.** By contrast, there was only a slight decrease of 3.78% in generation by gas-fired power plants to 10,718.7 GWh. The closure of the last nuclear power plants on 15 April 2023 has meant that the share of nuclear generation has fallen to zero.
Wholesale prices fall
In the second quarter of 2024 wholesale prices in the Germany/Luxembourg bidding zone were 26.9% down on the previous year. The average price of 67.48 euros per megawatt hour (€/MWh) was higher than the average of €58.94/MWh in Germany's neighbouring countries. The lowest negative wholesale price of negative €135.45/MWh was recorded between 1pm and 2pm on Sunday 12 May 2024. Negative wholesale prices (prices below €0/MWh) occurred in a total of 192 hours, three times more frequently than in the second quarter of 2023 (64 hours with negative prices). Prices above €100/MWh were recorded in a total of 422 hours, less than half as often as a year earlier (984 hours with prices above €100/MWh).
Day-ahead wholesale electricity prices in Germany | ||
Q2 2024 | Q2 2023 | |
Average [€/MWh] | 67.48 | 92.29 |
Minimum [€/MWh] | -135.45 | -129.96 |
Maximum [€/MWh] | 235.52 | 207.92 |
Number of hours with negative prices | 192 | 64 |
Number of hours with prices above €100/MWh | 422 | 948 |
On 25 June 2024 the EPEX Spot exchange experienced technical problems, resulting in an outage in market coupling in day-ahead trading for the delivery day of 26 June at times. During this period, Germany had to meet the majority of the demand for electricity with domestic sources, resulting in an increase in prices up to as much as €2,325.83/MWh. These prices were not visible on the SMARD website as, because of the problems on EPEX Spot, the German prices on the EXAA and Nord Pool exchanges (which were not affected) were shown.
This shows how important the European internal electricity market is for electricity trading and the advantages it offers for consumers. Market coupling makes it possible for electricity to be produced first and foremost wherever generation is cheaper, in most cases by renewable energy sources. This in turn reduces prices and the carbon impact in the system as a whole.
More electricity exports and imports
Germany exported a total of 6,988.6 GWh of electricity, 8.2% more than in the second quarter of 2023. Germany exported most electricity to Austria (1,427 GWh), Poland (1,258.8 GWh) and Czechia (1,195.6 GWh). The average wholesale prices in Poland (€90.58/MWh) and Czechia (€69.42/MWh) were higher than in Germany, while the average price in Austria (€63.53/MWh) was slightly lower.
Germany imported a total of 18,102.8 GWh of electricity, up 18.4% on the second quarter of 2023. The largest amount was imported from France (4,507.3 GWh), followed by Denmark (3,431 GWh) and Switzerland (3,020 GWh). As France, together with Germany, is one of the largest electricity producers in Europe, the majority of imports usually come from Germany's neighbouring country. The average wholesale price in France was €30.96/MWh, considerably lower than in Germany.
The largest change was in net imports from Belgium, which increased by 431% to 1,247.1 GWh as a result of gross imports increasing by 107.8% and gross exports falling by 46%. The main reason for this is the change in the difference between the prices in the two countries. There was a decrease in the average wholesale prices in both countries compared with the second quarter of 2023, but the decrease in Belgium (2023: €92.81/MWh; 2024: €54.44/MWh) was larger than in Germany. In the second quarter of 2024 the wholesale price in the Germany/Luxembourg bidding zone was higher than the price in Belgium in 1,552 out of 2,184 hours and was the same in 193 hours. By contrast, in the second quarter of 2023 the German wholesale price was higher than the Belgian price in 790 out of 2,184 hours and was the same in 792 hours.
In the second quarter of this year, Germany imported 11,114.2 GWh more electricity than it exported, making it a net importer. The difference between imports and exports in the second quarter of last year was 8,830.1 GWh, representing a year-on-year increase of 25.87%.
An overview of Germany's commercial foreign trade in electricity in the second quarter of 2024:
- Austria:
Exports: 1,427.0 GWh Imports: 643.9 GWh - Belgium:
Exports: 266.6 GWh Imports: 1,513.6 GWh - Czechia
Exports: 1,195.6 GWh Imports: 466.2 GWh - Denmark 1:
Exports: 584.1 GWh Imports: 2,569.3 GWh - Denmark 2:
Exports: 282.4 GWh Imports: 861.7 GWh - France:
Exports: 265.8 GWh Imports: 4,507.3 GWh - Netherlands:
Exports: 890.7 GWh Imports: 1,568.2 GWh - Norway:
Exports: 325.9 GWh Imports: 1,883.7 GWh - Poland:
Exports: 1,258.8 GWh Imports: 352.7 GWh - Sweden
Exports: 148.0 GWh Imports: 716.0 GWh - Switzerland:
Exports: 343.7 GWh Imports: 3,020.0 GWh
________________________________________
*The actual generation is the net electricity generation. It is the electricity fed into the general supply network less the electricity consumed by power plants themselves. It does not include electricity generated in the Deutsche Bahn network or within industrial networks and closed distribution networks.
**Only figures from 1 January 2015 onwards are available on the SMARD website.